
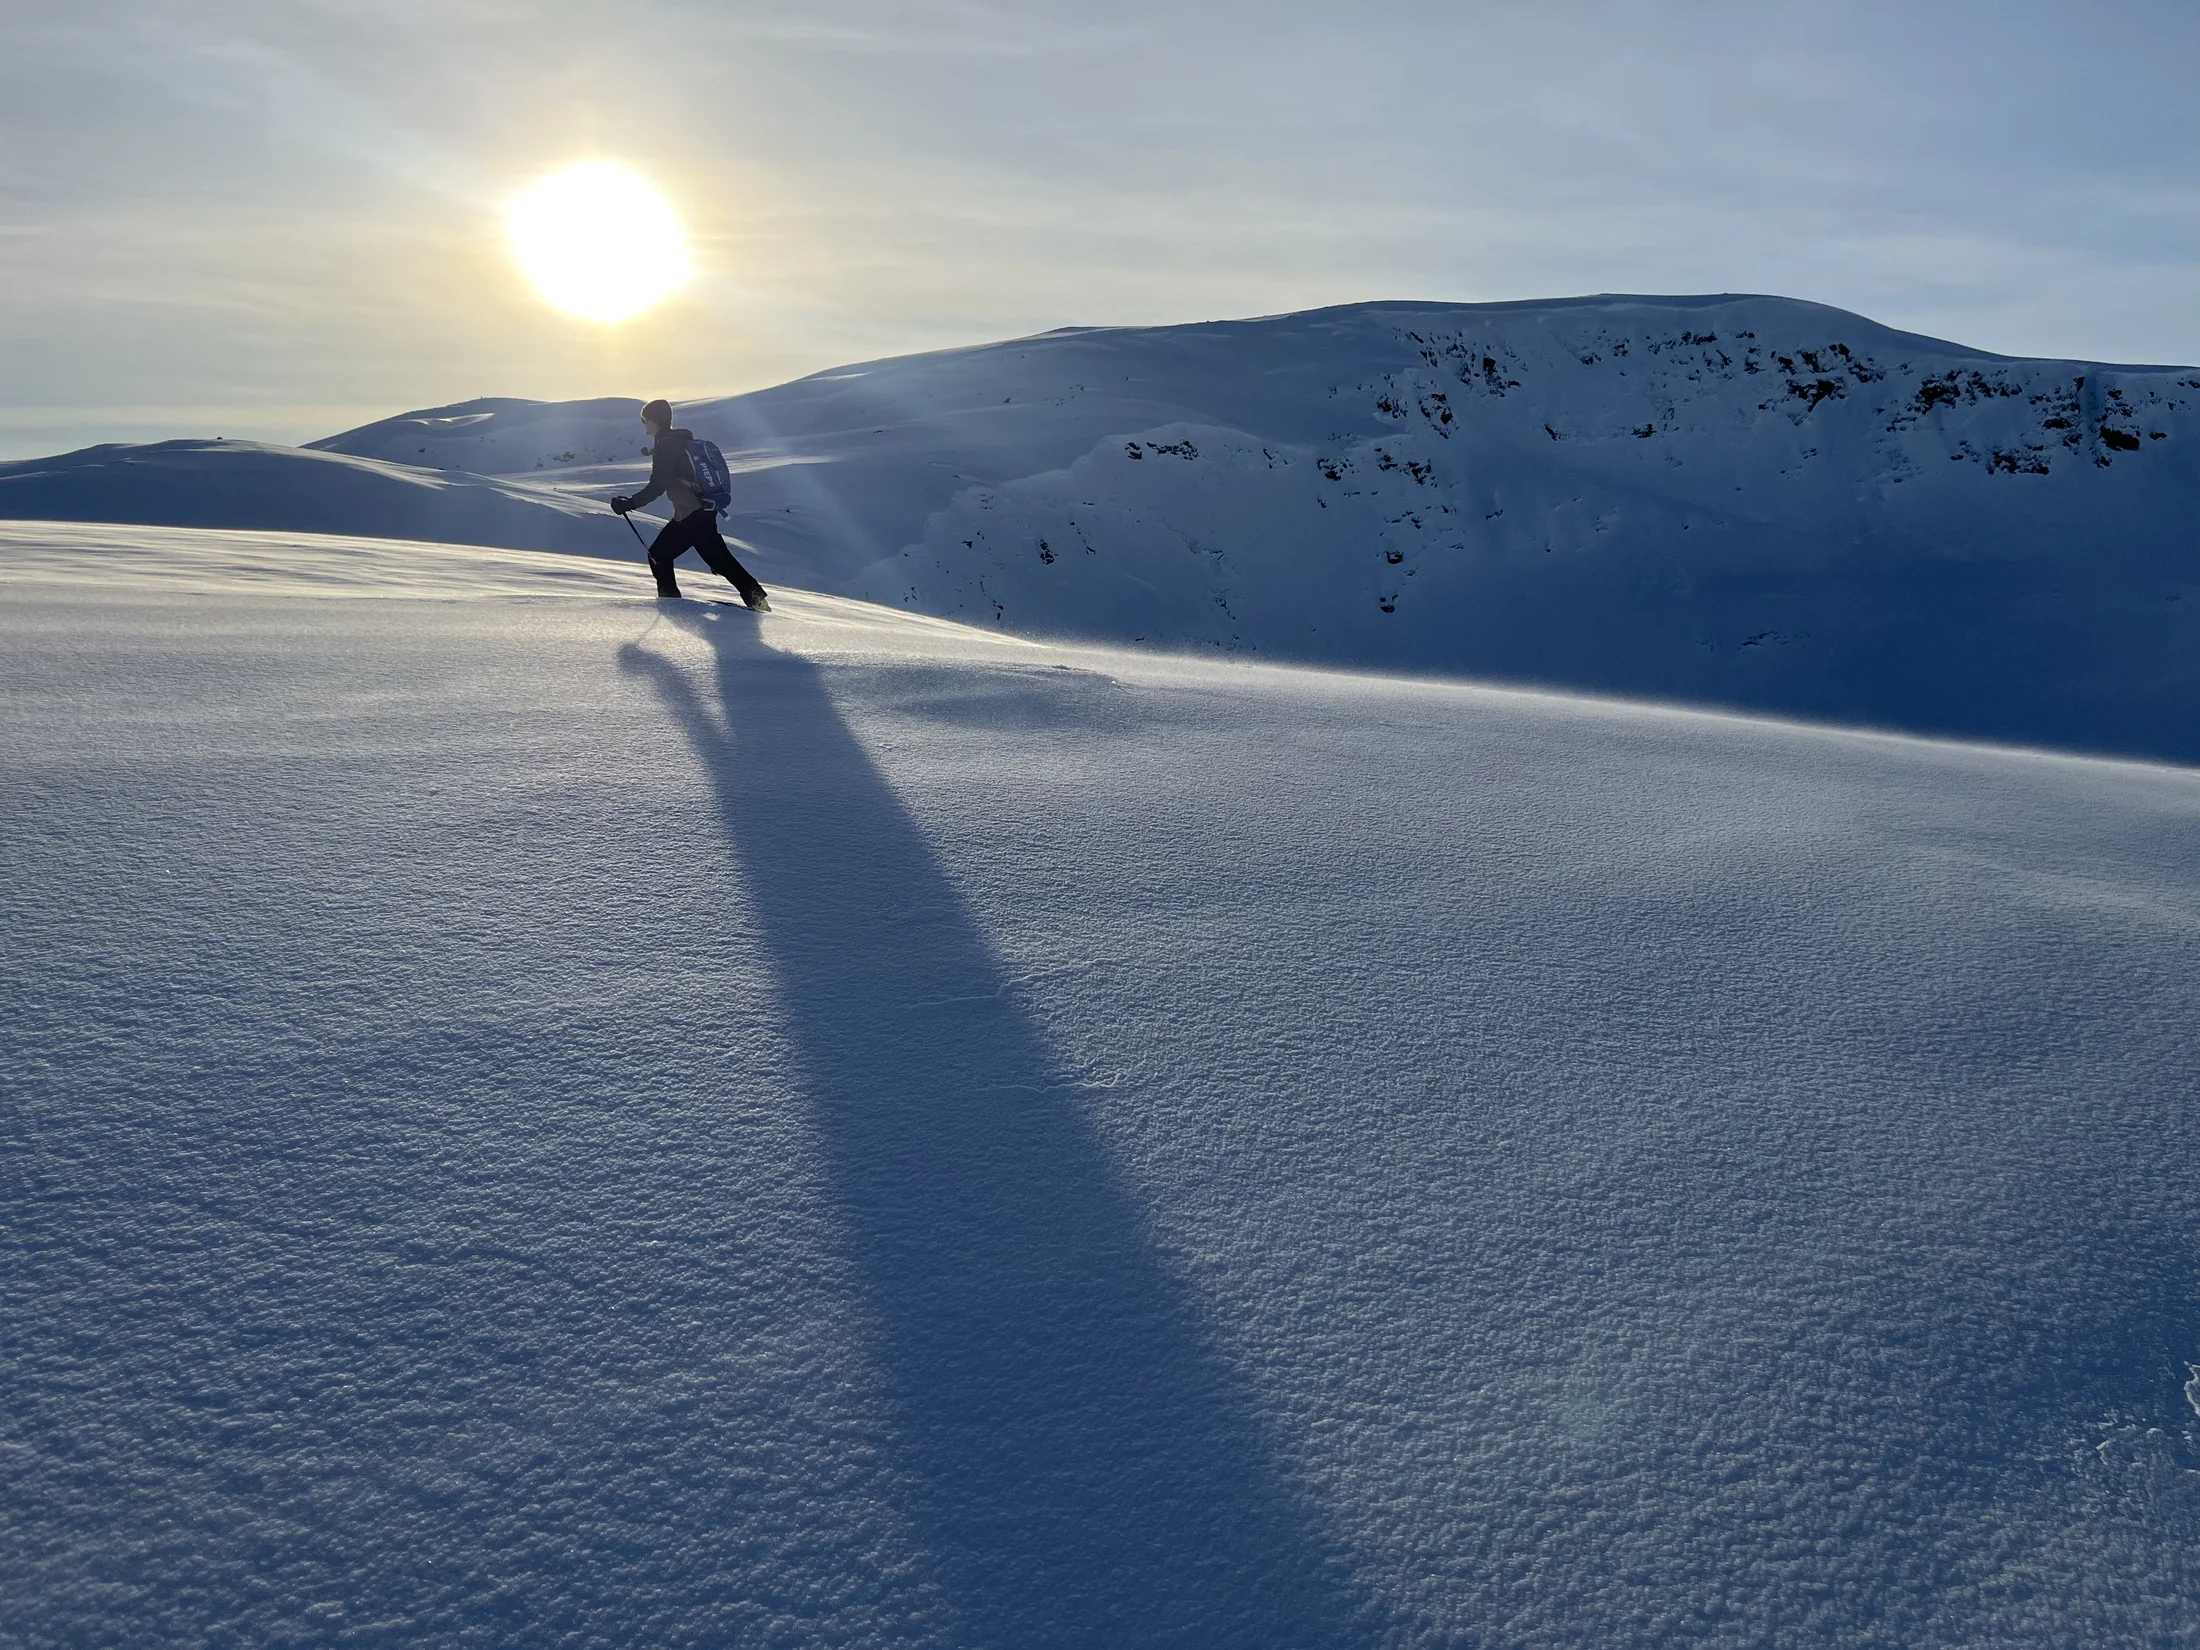
It’s the night before a tour. The guidebook is open on the table, someone has a laptop out, and the group is trying to figure out where to ski tomorrow.
This is a similar scene for many backcountry skiers, and scarce information can often make deciding where to go long and arduous. Recent reports from the backcountry are sparse, and for a lot of places they don’t exist at all. Avalanche forecasts are invaluable, but a single forecast often covers a very large area, and plenty of regions don’t have one. So you end up piecing together what you can find and making an informed guess about where the best skiing will be.
We built Snowpack Labs to provide more information and clarity when deciding where and when to ski in the backcountry. Our product simulates the snowpack itself, so we can give you high-resolution snow conditions, avalanche danger, and weather information for the terrain you’re actually looking to ski.
Our model
We have developed the Alpine Integrated Modeling System, or AIMS. It works in three steps, taking coarse weather model predictions and turning them into high-resolution weather and snowpack information.
AIMS Weather Model
Large-scale weather models often aren’t usable in the mountains, where conditions change over very short distances. Because of this, our first step is to downscale weather from coarse weather models to local terrain, using a combination of physically based rules and machine learning. This makes our weather information more actionable for you and gives our snowpack model the high-resolution weather inputs it needs.
AIMS Snow Model
Next, we feed the downscaled weather into our physically based snowpack model. It simulates what’s happening throughout the snowpack as snow accumulates, settles, compacts, melts, and refreezes. That lets us give you hour-by-hour snow conditions for any route.
We turn those conditions into a ski quality rating from Poor to Great. See how we rate snow quality.
AIMS Avalanche Model
Finally, we use our high-resolution weather inputs to run a machine learning-based avalanche model, allowing us to predict slope-scale avalanche danger. For each of five avalanche problems (wind slab, storm slab, persistent slab, wet loose, and wet slab), our model predicts how likely you are to trigger an avalanche and how large that avalanche would be if you did. It then turns those likelihoods and sizes into a danger rating from 1 through 4, the same scale avalanche centers use. We stop at 4 because Extreme (5) days are too rare to learn well. We built this model by training a purpose-built machine learning algorithm on more than 790,000 past forecasts from about 55 forecast zones at 18 avalanche centers across the western United States.
How well do our models work?
We test our models against observed snow and avalanche conditions to understand how well they predict snow and avalanche conditions in situations they haven’t seen before.
Snow
We test the AIMS Snow Model by checking how well it recreates snow depth and snow water equivalent (how much water is stored in the snowpack) over the course of a season. These numbers are hard to get right by accident. To get snow depth and snow water equivalent right, the model has to get the incoming snowfall right, predict how the snow settles, and then predict how fast it melts under different conditions. If a model can do that across many locations and winters, it’s doing a good job of simulating the snowpack, and that’s what lets us give you accurate surface conditions.
In general, our model does well at simulating the snowpack throughout the course of a season. We compared it with 36 SNOTEL stations across California, which measure snow depth and snow water equivalent every day, over the six winters from 2021 through 2026. None of these stations is used to train the model. On days with snow on the ground, our model predicts snow depth within about 12 inches of the measured depth on average, and it predicts the day the snow completely melts out within about two weeks of the observed date on average. The figure below shows how our model tracked snow depth over the 2025–26 winter at the Central Sierra Snow Lab near Donner Pass.
Avalanche
To test our avalanche model, we compare its predictions with the forecasts that avalanche centers actually issued. We take each avalanche center forecast zone, average our weather across that zone, and have the model predict the avalanche danger for each elevation band and day. We then compare that prediction with the danger rating the avalanche center published for the same zone, elevation band, and day. We always test the model on a winter it did not see during training: for each of the six winters from 2021 through 2026, we train the model on the other five and test it on the one we left out.
Overall, our model predicted the same danger rating as the avalanche center on 61% of forecast days and was within one danger level on 96%, with an average error of 0.42 danger levels. The table below breaks this down by danger level. For example, when the avalanche center forecast Considerable danger, our model also predicted Considerable 61% of the time, predicted Moderate 24% of the time, and predicted High 12% of the time.
| Our model said | ||||
|---|---|---|---|---|
| The avalanche center said | Low | Moderate | Considerable | High |
| Low | 67%25,365 | 27%10,447 | 6%2,099 | <1%90 |
| Moderate | 17%6,352 | 57%21,665 | 25%9,273 | 1%453 |
| Considerable | 3%685 | 24%4,760 | 61%12,020 | 12%2,369 |
| High | 2%56 | 3%124 | 43%1,568 | 52%1,896 |
To show what this looks like over a full season, the figure below compares our model with the Eastern Sierra Avalanche Center’s forecasts for the 2025–26 winter, which the model did not see during training. We chose this season because the model’s performance was close to its overall average: near treeline, the average error was 0.43 danger levels, close to the 0.42 across all avalanche centers.
The top two panels show the weather for context: daily snowfall and the daily high temperature, averaged across the forecast zone. Below that are the danger ratings from the avalanche center and from our model, followed by the avalanche problems each identified. As in a typical avalanche center forecast, we show the highest danger across all eight aspects, and we show an avalanche problem as present if it was listed on any aspect. You can switch between elevation bands with the buttons above the figure.
The model follows major storms closely. The danger rose sharply in both forecasts during the Christmas storm, and both stayed at Low through the long dry spell in late January and early February. In March, a stretch of warm weather brought wet loose and then wet slab problems into both forecasts. The model does differ from the avalanche center forecast in some ways, however. For example, it kept a persistent slab problem into early March after the avalanche center had removed it.
Use with care
Even with these results, we want to be clear: our model won’t always be right. We hope it’s genuinely useful, but Snowpack Labs is meant to be one more tool in your decision-making toolbox. It should never replace reading the forecast from your local avalanche center, reading posted observations, making your own observations in the field, or using your own judgment. Please use this product thoughtfully.